Christmas season is upon us and geez has the year flown by. Below is a reflection on the year’s returns and what to expect/how to position going forward.
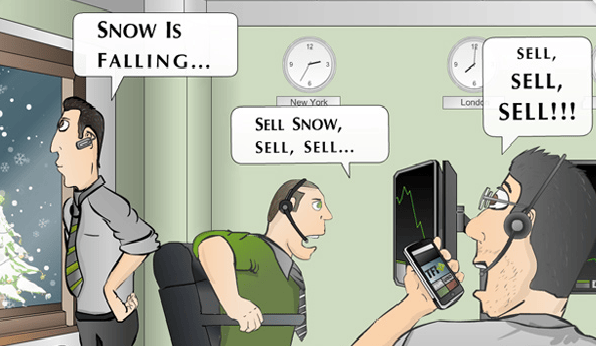
Returns year to date have been tepid in the US and abysmal in Europe and Asia.
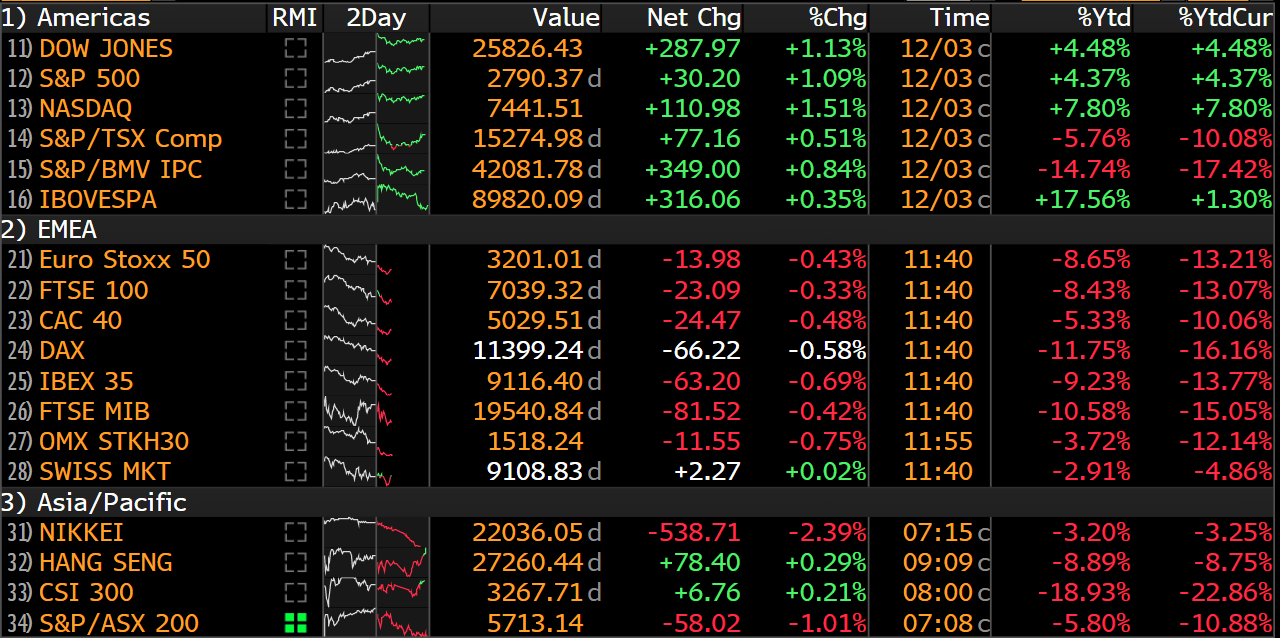
The question is, what should investors expect moving into 2019?
Growth expectations are fading. The US-China trade truce enthusiasm faded fast. Futures were up sharply following the news yesterday, but have since sold off. Risks in the coming year include the US-China trade dispute, Brexit, France revolutions, , and sky-high housing prices (Chart 1.1).
Chart 1.1: S&P/Case-Shiller US Home Price Index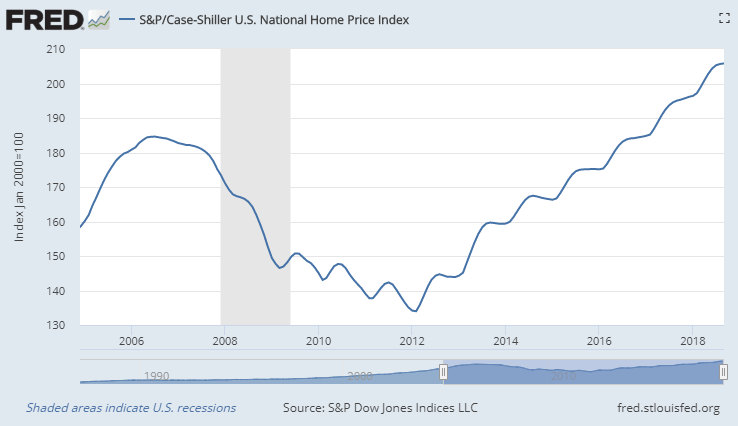
Longer-dated US Government bond yields are falling on recent Fed statements and tempered future growth expectations. Falling bond yields denotes more demand for bonds over equities.
Table 1.1: Change in Government and Corporate Yields MoM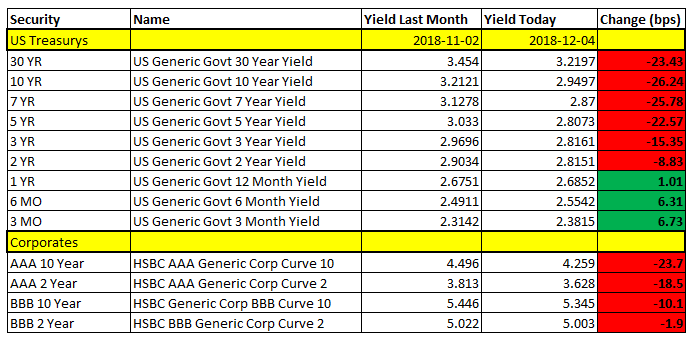
Table 1.2: Changes in credit spreads are mixed, but Govt to riskiest Corp’s (BBB) has risen.
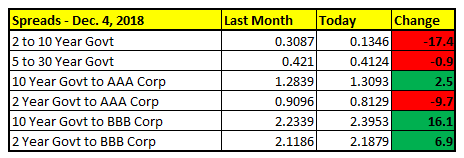
Chart 2.1: Longer-dated treasury yields are falling, while the short-term is rising.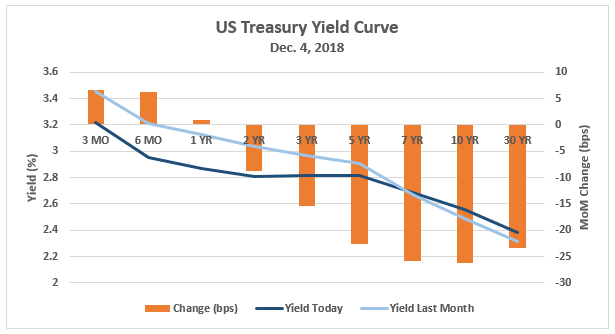
Corporate to Government credit spreads are rising; this means there’s more of an appetite for safer govvies than riskier corporate debt, though demand for both has risen. The rise in short-term yields can be explained by recent Fed communications. (
BBG). The
WSJ reports:
The move [in Treaurys] marked a further narrowing in the spread between U.S. 10-year and two-year Treasurys to just 0.14%, the slimmest gap in more than a decade…
This recent demand for safer assets reflects concerns over continued US growth. Recent equity earnings growth estimates are also falling, with Goldman strategist Christian Mueller-Glissman writing, “Expect better but still low returns for 2019… we see a weaker expected macro backdrop in 2019 as likely to limit return potential.” (Bloomberg).
Oil has tanked since October, falling nearly 29% from $76.90/barrel down to $54.41/ barrel today. Whether low oil is good or bad for markets is up for interpretation. Using a simple linear regression analysis provided by Bloomberg (Chart 3.1), we can see the prices of each are positively related; i.e. higher oil is better for the economy or strong economy means higher oil prices (note: super low R squared).
Chart 3.1: Oil Prices (CL1 Comdty) vs. S&P 500 Index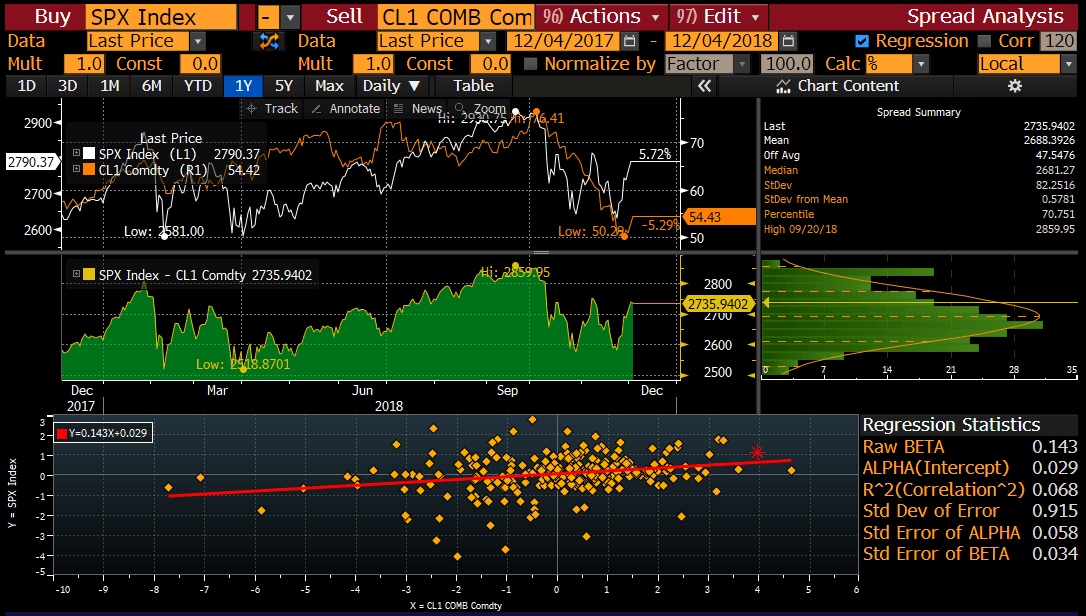
Bitcoin has also been crushed this year, breaking below $4,000 after trading above $19,500 last December.
Chart 4.1: Cryptos take a bath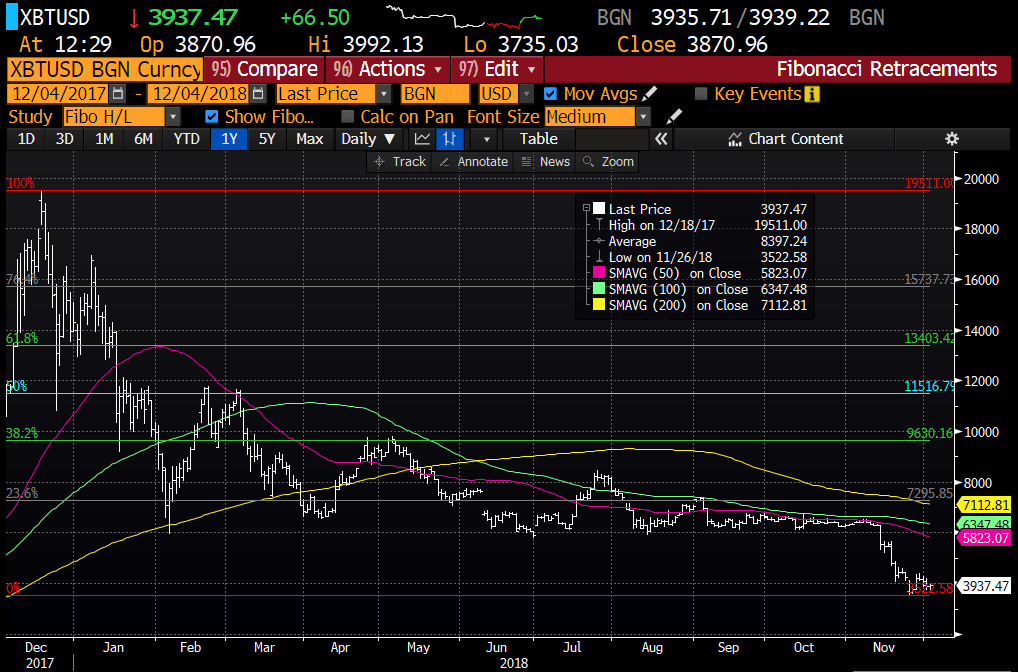
Here’s a
headline for you:
JPMorgan Asset Says Cash Better Than Stocks for First Time in Decade
Not bullish.
Bottom line:
The market appears to be fleeing risky assets in favor of bonds and cash. Buy value stocks with medium dividends to preserve total returns in the face of falling asset returns. There’s not enough meat on the bone for me to recommend switching into bonds, as you can buy a company like Clorox at 2.25% dividend yield and the 10-year trades around 3%. People will still buy bleach in a recession. Seek value, get out of growth. Definitely get out of the FAANG’s. Watch the FOMC meeting on Dec.18 for clues on 2019 monetary policy.
Remember, things don’t have to go from great to bad for markets to fall, just great to good.
Good luck out there. Stay warm and thanks for reading,
/Tommander-in-chief
Disclaimer: Seek the advice of an accredited financial advisor before acting on the opinions presented above. I hold a position in CLX stock and do not plan to exit within the next 30 days. My opinions are my own and do not reflect on my employer.


 fungible thoughts
Leave a comment